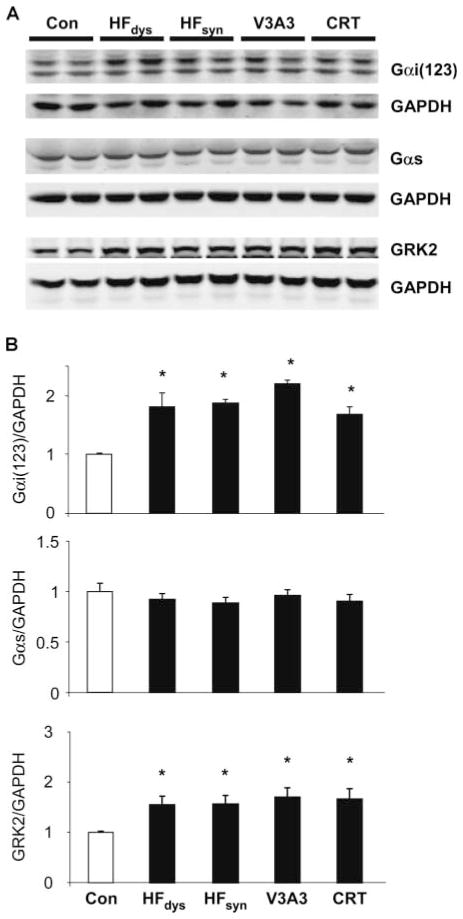
Fig. 4.
Protein expression of Gαi and GRK2 but not Gαs increases in each HF model over control. (A and B) Western blots (A) and summary densitometry (B) for protein levels of Gαi(1,2,3), Gαs, and GRK2 (n = 4 to 5 per group). Analysis is normalized to GAPDH as a loading control. *P < 0.05 versus control.

