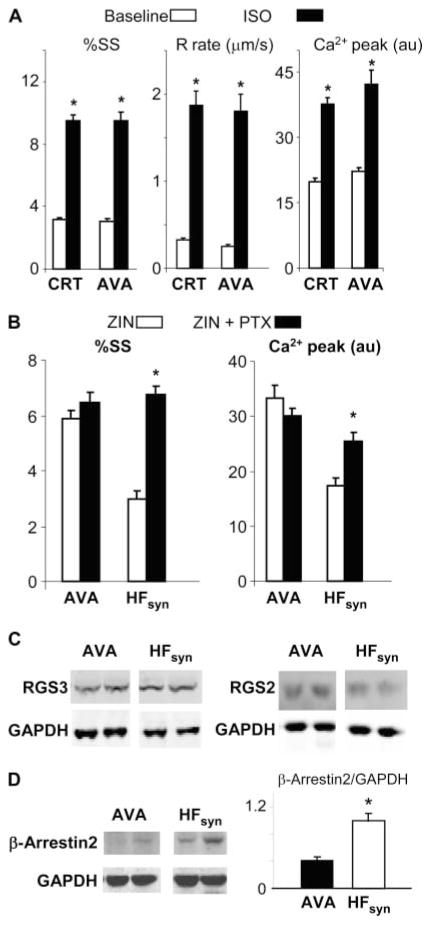
Fig. 7.
Enhanced β-AR responsiveness in myocytes from hearts exposed to RV (dyssynchrony) pacing during the middle 2 weeks of otherwise 6-week atrial tachypacing (AVA). (A) %SS and peak Ca2+ transients are similar at baseline and after isoproterenol stimulation in myocytes from an AVA heart to those observed after CRT. *P < 0.001 versus baseline (nonstimulated). (B) Minimal augmentation of functional or Ca2+ response to zinterol in AVA myocytes by addition of PTX. Data are compared with the HFsyn model, which displayed marked augmentation. *P < 0.05 versus zinterol alone. n = 12 to 20 cells per heart, n = 4 hearts for each group. (C) Protein expression for RGS3 and RGS2 in AVA model, shown in comparison with the HFsyn model. There was no up-regulation in this model, unlike CRT (n = 4 to 5 per model). (D) Protein expression (left) and summary densitometry (right) for β-arrestin2, shown in comparison to HFsyn data. Unlike HFsyn, which had no change in expression over control or the other models (fig. S4), AVA myocytes had very low levels. *P < 0.001.

