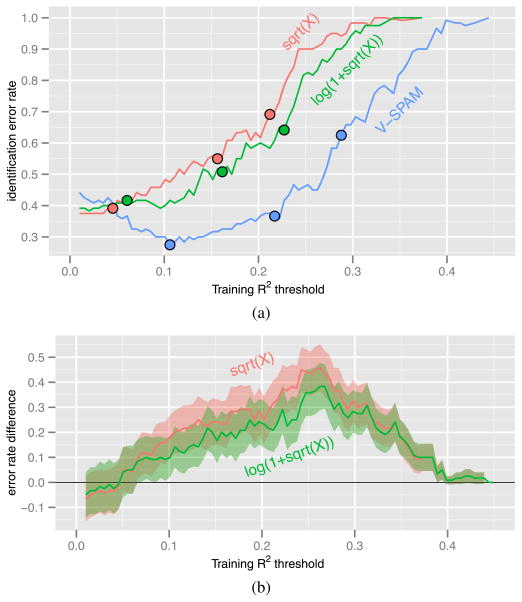
Fig. 11.
Identification error rate (5.4) as a function of the training R2 threshold (5.3) when the number of possible images is 11,499 + 1. (a) Estimated identification error rate. The solid circles on each curve mark the points where the number of voxels used by the decoding rule is (from left to right) 400, 200 or 100. (b) Pointwise 95% confidence bands for the difference between the identification error rates of (upper) sqrt(X) model (4.1) and V-SPAM; (lower) log(1 + sqrt(X)) model (4.2) and V-SPAM. The confidence bands reflect uncertainty due to sampling variation of the validation data.

