
Fig. 5.
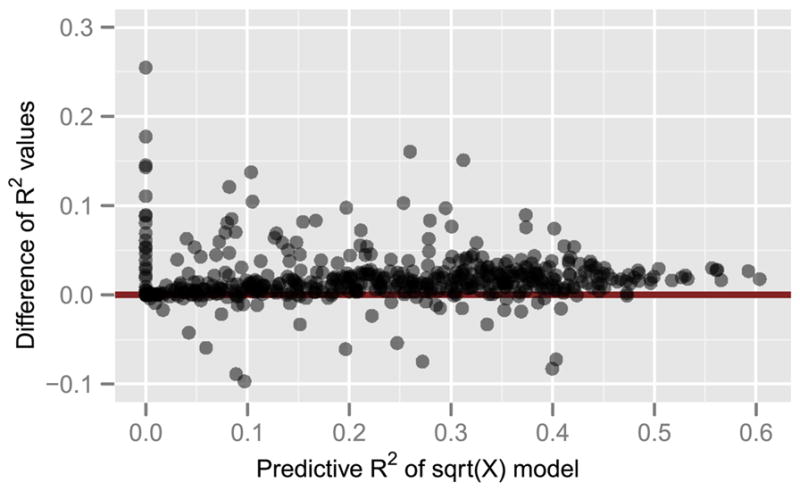
Comparison of voxel-wise predictive R2 (based on the validation data) of the log(1 + sqrt(X)) model (4.2) and the sqrt(X) model (4.1). The vertical axis shows the difference R2 of (4.2) −R2 of (4.1). The median improvement of model (4.2) is 5.5% for voxels where both models have a predictive R2 > 0.1.