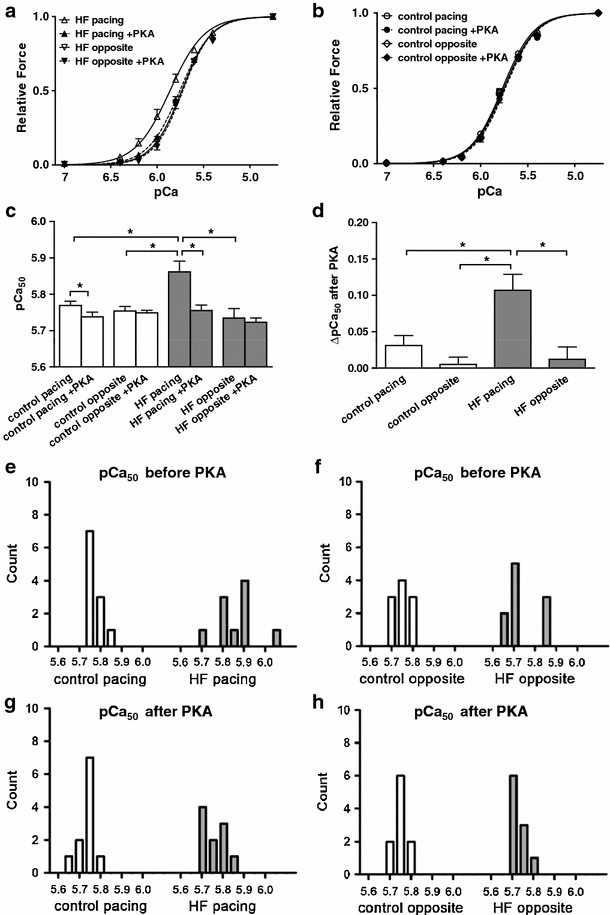
Fig. 5.

Mean Ca2+–force relations and distributions of pCa50 values in isolated cardiomyocytes. a Ca2+–force relations of isolated cardiomyocytes obtained from the pacing and opposite sites of the HF animals before and after in vitro PKA treatments. The leftward position of the Ca2+–force relations at the HF pacing site before PKA treatment illustrated an increased Ca2+-sensitivity of force production in cardiomyocytes of this region relative to all others. After PKA treatment, a rightward shift in the Ca2+–force relation was observed. b Small differences between the Ca2+–force relationships of the control pacing and control opposite groups could be detected before and after in vitro PKA treatment. c Means of pCa50 values in the four groups of cardiomyocytes before and after in vitro PKA treatment. Mean pCa50 at the HF pacing site was significantly higher than in all other groups under basal conditions, and this difference could be eliminated by PKA (*P < 0.05). d PKA-evoked changes in pCa50 values in the four experimental groups. The effect of PKA on mean pCa50 was the highest at the pacing site of HF animals (*P < 0.05). The Hill coefficient did not differ significantly among the four experimental groups before and after PKA exposures (n Hill ~2.6). e–h Distributions of pCa50 values in cardiomyocytes from the four experimental groups before and after in vitro PKA treatment. pCa50 values of the HF pacing group were dispersed on a wider range than in all other groups. After PKA treatment, a narrower distribution for the pCa50 values could be measured in HF cardiomyocytes at the pacing site
