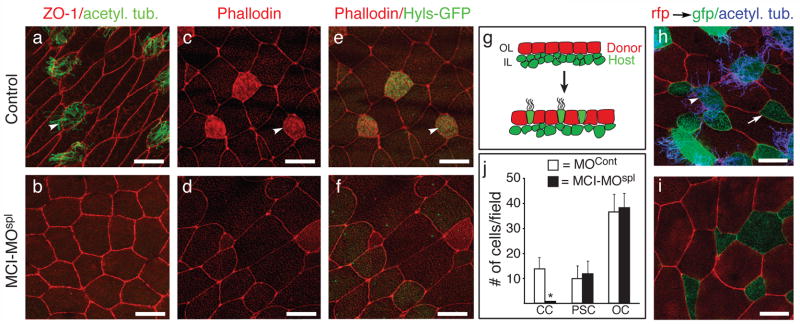
Figure 1. MCI morphants lack MCCs.
(a–b) Confocal images taken of the skin from embryos that were injected with a control morpholino (a) or a MCI splicing morpholino (MCI-MOspl, b), fixed at stage 28, and stained with ZO-1 (red) and acetylated-tubulin (green) antibodies to label cell boundaries and cilia, respectively. (c–f) Confocal images of the skin from embryos injected with a control morpholino (c,e) or with MCI-MOspl (d,f), along with Hyls-GFP RNA to label centrioles (green, e,f). At stage 28, embryos were fixed, stained with rhodamine-phallodin (red) to label actin, and imaged. (g) Diagram of a transplant assay where the outer epithelium (OL) was isolated at stage 10 from a donor embryo injected with mRFP RNA and transplanted onto the inner layer (IL) of a host embryo injected with mGFP RNA. (h–i) Host embryos were also injected with a control morpholino (h) or with MCI-MOspl (i), fixed at stage 28 when intercalation and differentiation is complete, and imaged by confocal microscopy after staining for cilia (blue). (j) Quantification of outer cells (OC, red), ciliated cells (CCs, green/blue) or proton secreting cells (PSCs, green) for transplants onto control and MCI-MOspl injected embryos, showing the average (±s.d.) for 15 fields from 5 embryos. CC formation is dramatically reduced (* p=6×10⁻⁹) while PSC and OC numbers are statistically the same. Scale bars=10 microns. Arrowheads (a,c,e,h) and arrows (h) denote MCCs and PSCs, respectively.

