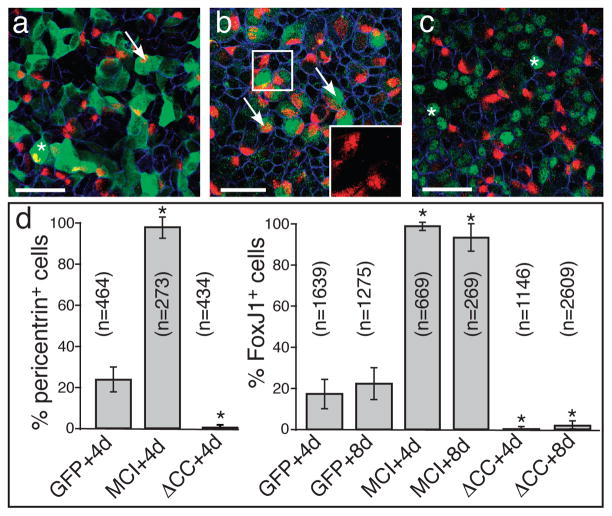
Figure 7. Mouse MCI governs MCC differentiation in MTEC cultures.
(a–c) MTEC cultures were established, infected with lentivirus expressing MT-MCI, MT-MCIΔCC or GFP as a control, and switched to ALI culture conditions. At 4 days post-ALI, cultures were fixed, stained for infected cells (green) using an antibody to the myc-tag or GFP, to pericentrin (red) to identify MCCs and to E-cadherin (blue) to label cell boundaries. Shown are examples of cultures infected with a virus expressing GFP (a), MT-MCI (b) or MT-MCI-ΔCC (c). Arrows and asterisks denote infected cells that are pericentrin positive or negative, respectively. The insert in panel b shows a higher power image of pericentrin staining that marks clusters of nascent basal bodies. Scale bars = 50 microns (d) Percentage of infected cells that were ciliated versus nonciliated based on FoxJ1 or pericentrin staining under each condition, where n=total # of infected cells scored under each condition (±s.d.). Values marked with an asterisk are statistically significant (p<1×10 −10) from the values obtained for the GFP controls.

