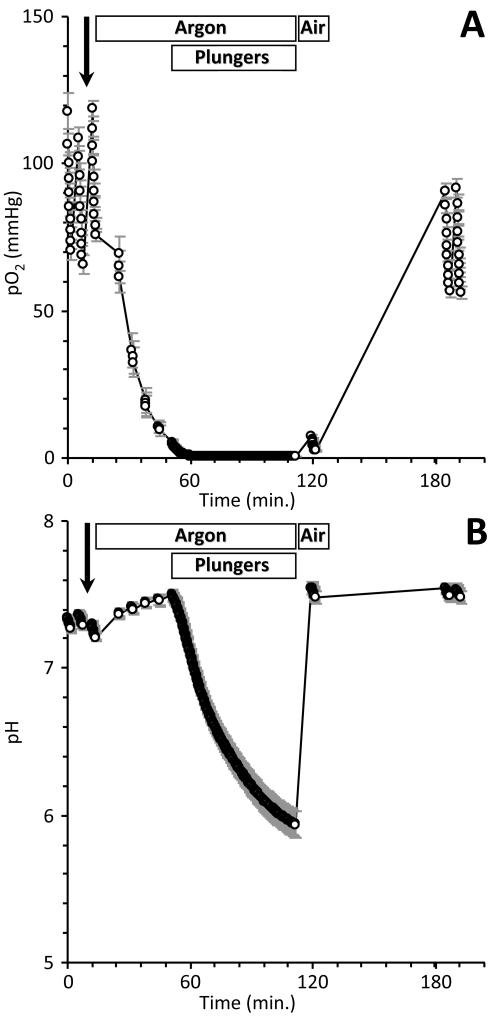
Fig. 2. Representative pO2 (A) and pH (B) traces during an IR experiment.
XF measurements were taken every 11 s. when in read mode. Rates of OCR and ECAR were obtained before and after molecule injection (bold arrow), and at the end of reperfusion. Argon or room air flow, and lowering and raising of plungers are indicated above the traces. The ischemic period, with plungers lowered, was 1 hr. Data are means of 22 wells on a plate, ± SEM, and are representative of the 39 plates screened.

