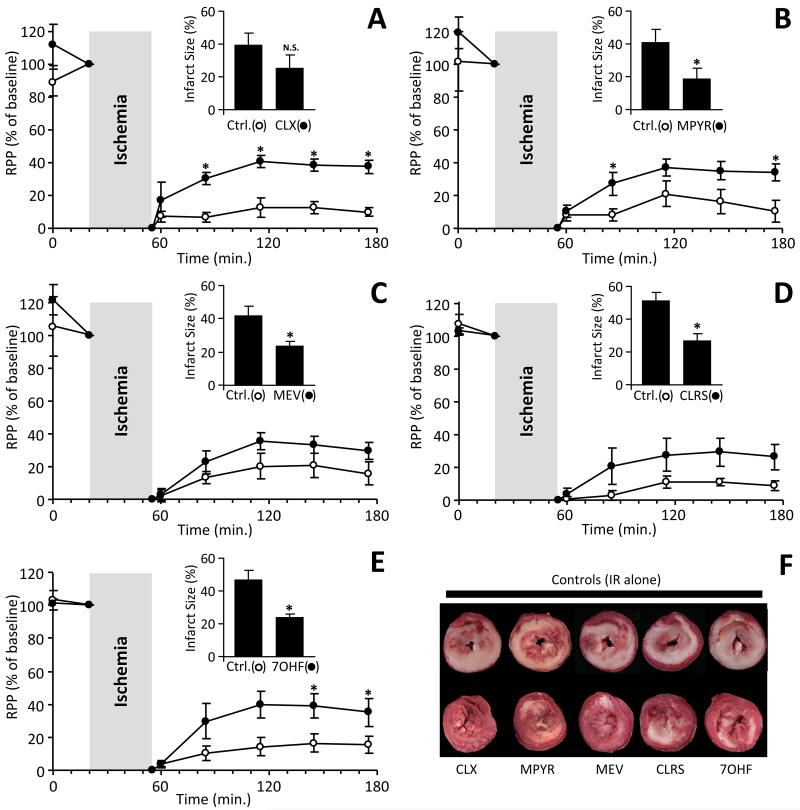
Fig. 4. Cardioprotection by hits identified from the screen.
Five molecules from the screen (Table 1) were administered to perfused rat hearts at 1 μM for 20 min., prior to 35 min. ischemia and 2 hr. reperfusion. Contractile function (rate x pressure product, RPP) is expressed as % of the value immediately prior to ischemia. Data are shown for A: cloxyquin (CLX), B: methapyrilene (MPYR), C: mevastatin (MEV), D: clorsulon (CLRS), and E: 7-hydroxyflavone (7OHF). Following reperfusion, infarct size was determined by TTC staining, with representative ventricular cross section images shown in panel F. (white = infarct, red = live tissue). Insets to panels A-E show infarct data for each group. Note that different controls were used for each molecule tested. All data are means ± SEM, N = 5-7, *p<0.05 between treatment group and vehicle controls, by ANOVA.

