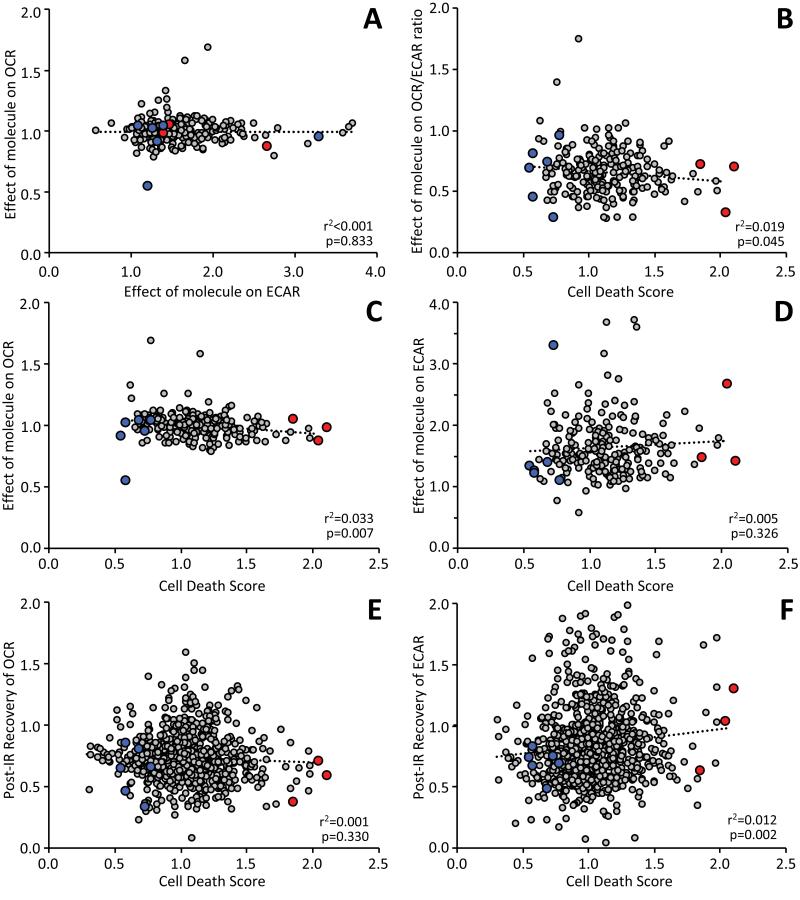
Fig. 6. Relationship between XF metabolic parameters and cell death in the second round screen.
Mitochondrial Ox-Phos (OCR) and glycolysis (ECAR) were measured at various time points during the IR protocol, from data of the type shown in Fig. 2. A: Relationship between the effect of added molecules on ECAR vs. effect on OCR. B: Relationship between post-IR cell death and the effect of added molecules on OCR/ECAR ratio. C/D: Data from panel B broken out into the individual relationships of cell death with effects of molecules on either OCR (C) or ECAR (B). E/F: Relationships of cell death with the post-IR recovery of either OCR (E) or ECAR (F). In panels A thru D, each point represents a single well/molecule from the second round (N = 224). In panels E/F, the effect of added molecules is not under investigation, so data from both screening rounds including controls (N=858) is shown. Linear regression fits are shown on all plots (dotted lines) with r2 and p values calculated as detailed in the methods. In each panel, the beneficial or detrimental compounds tested in intact hearts are shown in blue and red symbols, respectively.

