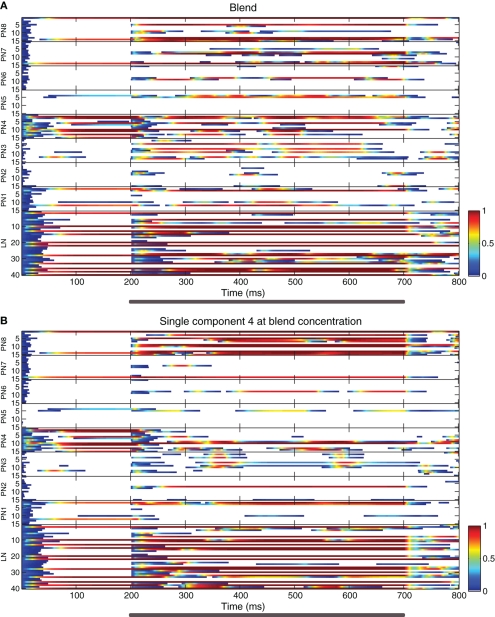
Figure 2.
Raster plots showing neuron activity in an example realization of the AL model. (A) Response to the homogeneous blend. (B) Response to a single component at blend concentration. The activity variable of each neuron is represented by a color code (shown in the scale bars at the lower right side of each panel) plotted against time. The ordinate's axis indicates the index numbers of the neurons: PNs belonging to each of the eight glomeruli (labeled PN 1 to PN 8, with 15 PNs per glomerulus) and 40 multiglomerular LNs (labeled LN). Odor stimulus duration is marked with gray bars under the abscissas.

