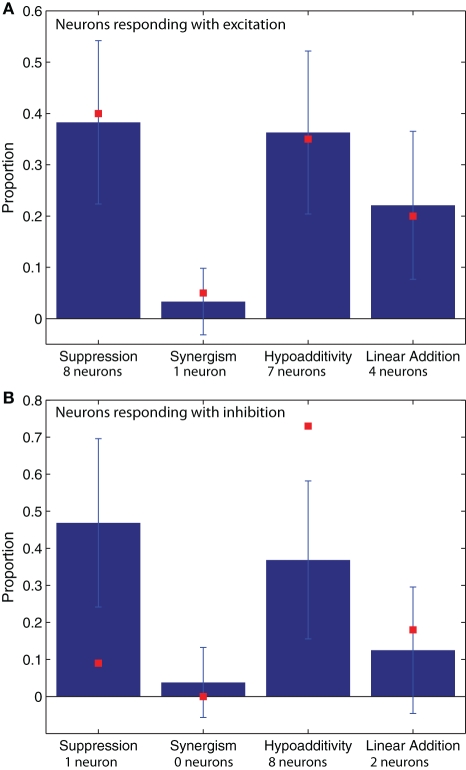
Figure 3.
The proportions of blend interaction types found in 100 model realizations (μ ± SD) are shown with blue bars. The data values obtained from the experimental recordings (N = 31 neurons) are plotted with red squares. (A) Neurons that respond with excitation (N = 20). (B) Neurons that respond with inhibition (N = 11). The number of neurons used to compute the proportions represented by the red squares are provided under their corresponding abscissa labels. For the model simulations of neurons that respond with excitation (blue bars in A) the neuron numbers were 901 for suppression, 822 for synergy, 546 for hypoadditivity, and 81 for linear addition. For the neurons that respond with inhibition (blue bars in B) the neuron numbers were 622 for suppression, 520 for synergy, 179 for hypoadditivity, and 54 for linear addition.

