Figure 1.

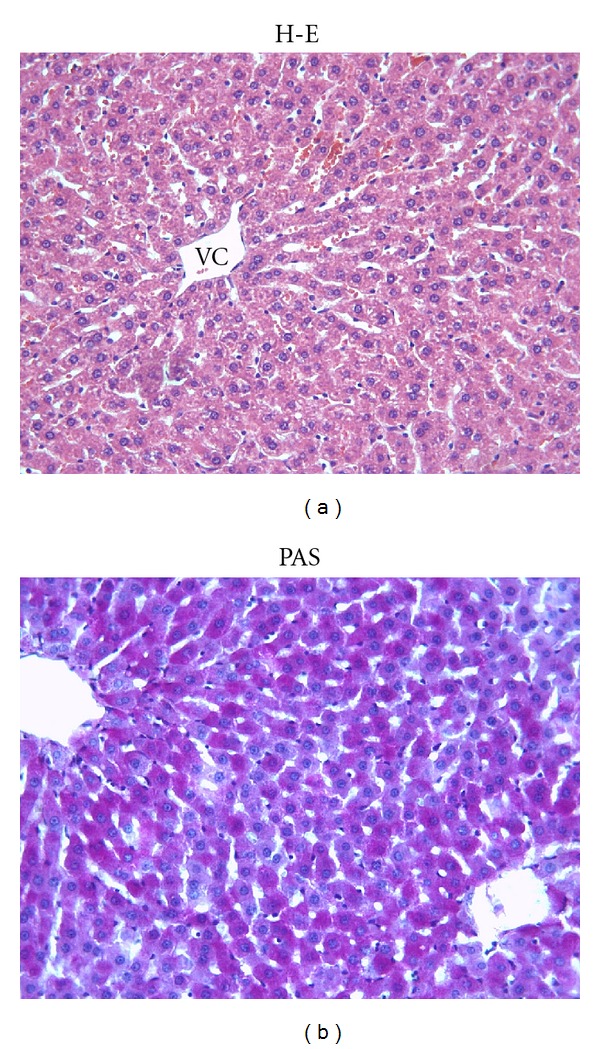
(a) Normal histological appearance of liver in the control group. VC: Vena centralis. (b) The PAS-positive reaction shows a magenta staining where glycogen is present within hepatocytes. X66.

(a) Normal histological appearance of liver in the control group. VC: Vena centralis. (b) The PAS-positive reaction shows a magenta staining where glycogen is present within hepatocytes. X66.