
Figure 2.
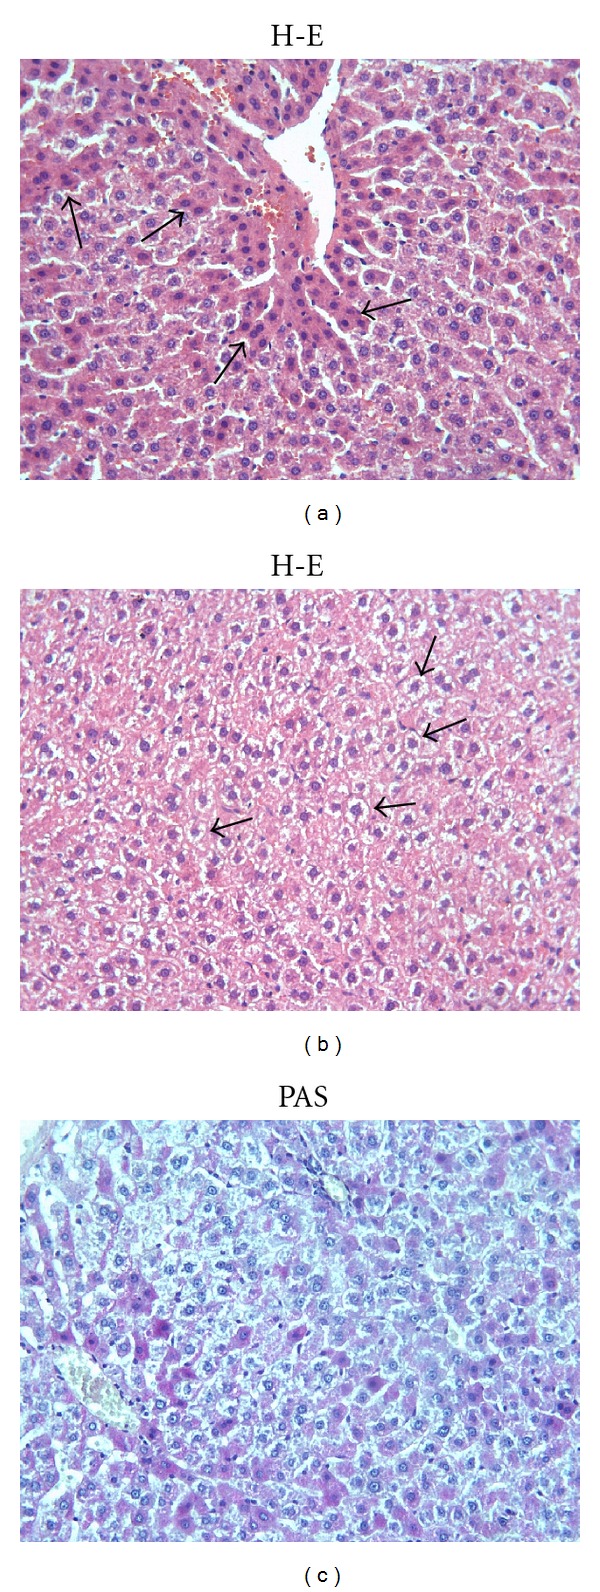
(a) Hepatocytes with eosinophilic cytoplasm (arrows) are observed in Mtx group. (b) Cellular swelling in hepatocytes (arrows) is noticed in Mtx group. (c) Marked reduction in glycogen content in Mtx group. X66.
Official websites use .gov
A
.gov website belongs to an official
government organization in the United States.
Secure .gov websites use HTTPS
A lock (
) or https:// means you've safely
connected to the .gov website. Share sensitive
information only on official, secure websites.
(a) Hepatocytes with eosinophilic cytoplasm (arrows) are observed in Mtx group. (b) Cellular swelling in hepatocytes (arrows) is noticed in Mtx group. (c) Marked reduction in glycogen content in Mtx group. X66.