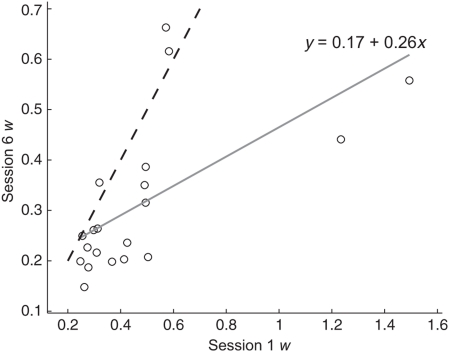
FIGURE 3.
Numerosity w scores calculated from session 6 plotted against numerosity w scores calculated from session 1. The dashed line shows equality. Participants below the equality line showed improvement in ANS acuity between sessions 1 and 6.The solid gray line is the best fit to the data and the equation shows the intercept and slope (r2 = 0.40, p < 0.005).

