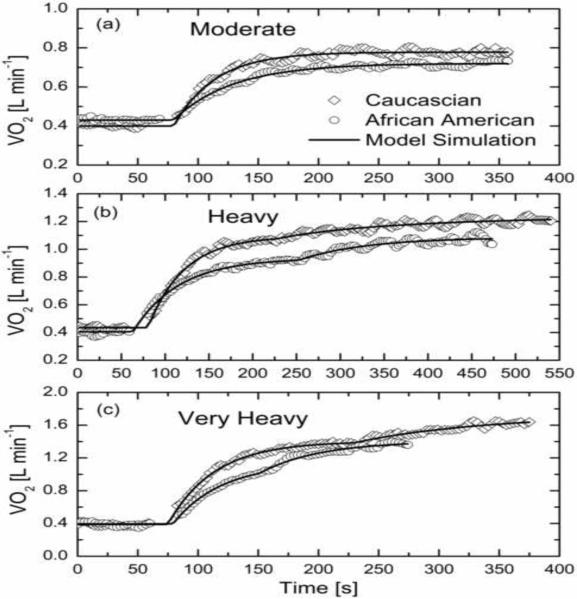
Figure 1.
Comparison of model simulations (line) and experimental data of mean VO2 on-dynamic response to constant work rate exercise of moderate (M) (a), heavy (H) (b), and very heavy (VH) (c) intensity in a representative African American (circles symbols) and Caucasian (diamond symbols) women. The graphs of the mean responses are showed with 2 seconds intervals of time- and ensemble-averages of interpolated and time-aligned breath-by-breath data from individual transitions from warm up at 20 watts.

