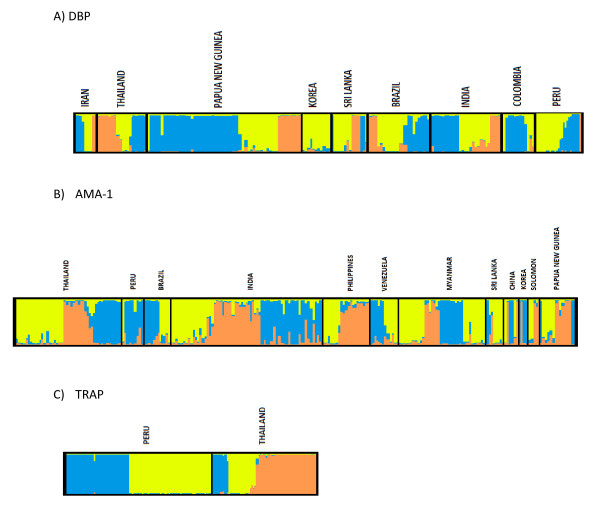
Figure 2.
Global population structure of the genes encoding P.vivax vaccine antigens based on Bayesian cluster analysis. Each haplotype is represented by an imaginary bar, which is partitioned into K coloured segments that represent the membership fraction of each haplotype in K clusters (K = 3, represented by the three different colours blue, yellow and orange). Samples are grouped in boxes according to their geographic origin.

