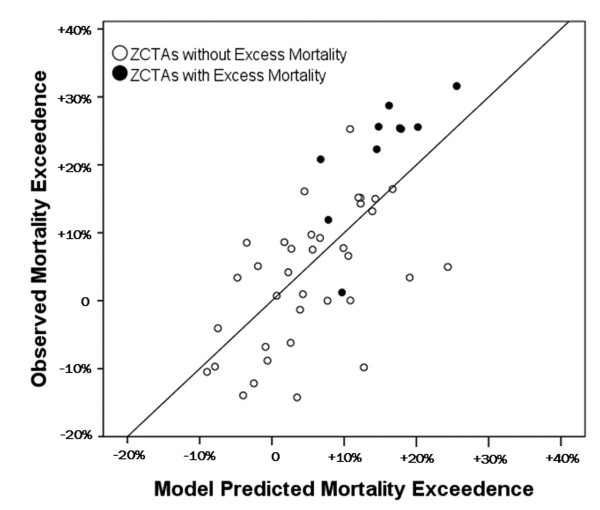
Figure 6.
Comparison of model predictions and observations. Scatterplot comparing observed mortality rates and model predictions on days following 7:00 p.m. local time apparent temperatures above 34°C by ZCTA. The 1:1 line is included for reference. Filled circles identify the 10 ZCTAs with statistically significant mortality exceedances in Figure 1.

