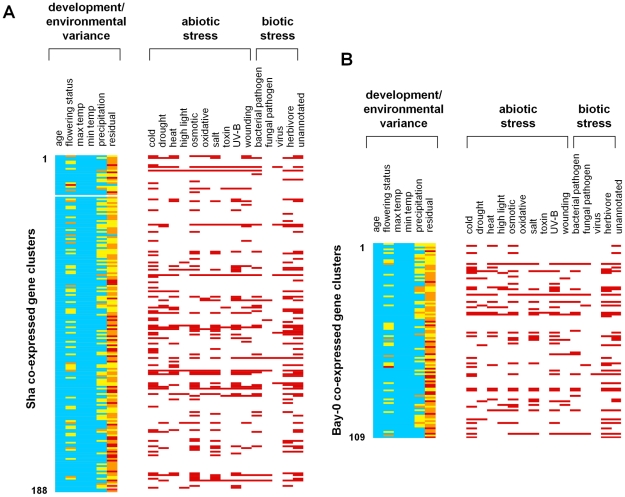
Figure 5. Gene expression clusters in A. thaliana field transcriptomes.
Silhouette analysis defined (A) 188 clusters in Sha and (B) 109 clusters in Bay-0. Each row indicates a specific cluster. The components of the transcriptional variance explained by environmental (precipitation, maximum and minimum daily temperatures) and developmental factors (age and flowering status) are shown. The percent of the transcriptional variance explained by a factor is shown in color (blue, <25%; yellow, between 25–50%; orange, between 50–75%; red, >75%). We also examined each cluster for enrichment of genes shown to be differentially expressed in previously-studied transcriptome analyses. A red bar indicates that the cluster is enriched in genes differentially expressed under that stress condition.

