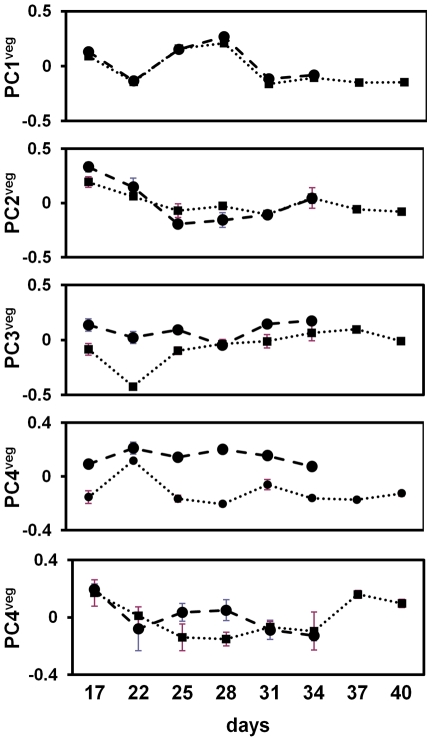
Figure 6. Vegetative stage principal component analyses of A. thaliana field transcriptome.
The first five principal components are indicated. Principal component scores are on the y-axis and sampling days on the x-axis. The dashed line gives the PC score for Bay-0 and the dotted line for Sha. At each sampling day, the mean PC score across the three replicates are given for Bay-0 (circles) and Sha (squares), with standard error bars (+/− 1 SE).

