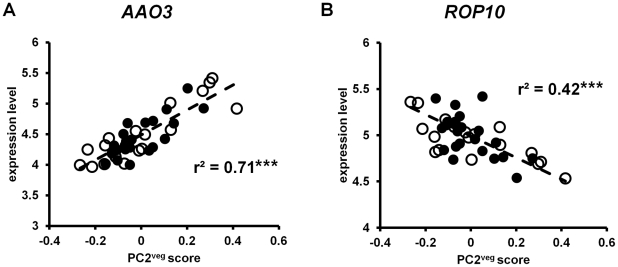
Figure 8. Gene expression in A. thaliana under field conditions correlated with PC2veg.
Each point is the LS mean expression level of (A) ROP10 and (B) AAO3 in Bay-0 (open circles) and Sha (closed circles) for each timepoint. The dashed line shows the linear regression through the data. *** = p<0.001.

