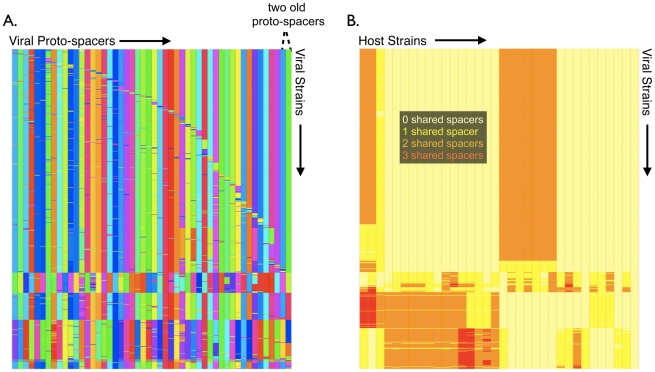
Figure 7. Clustering by immunity reveals diversity during viral bloom.
(A) The 651 viruses at the model predicted bloom (iteration 768 in Figure 6B) are shown along the rows, with the virus' 50 aligned protospacers shown along the columns. Distinct proto-spacers are colored differently. Strains are then clustered based on proto-spacer relatedness. The two proto-spacers providing immunity at the bloom (Figures 6B and S8), are shifted to the two rightmost columns for clarity. Five distinct viral sub-populations are observed in the mosaic, with the largest blooming sub-population characterized by closely related mutants sharing the two critical proto-spacers in their rightmost columns. (B) Viral and host sub-populations at the bloom are superimposed on one another to reveal ‘cloud on cloud’ immunity at the bloom. The rows contain viral strains and the columns show host strains. Each entry of the heat-mapped ‘immunity matrix’ shows the number of shared spacers between the respective host and viral strain. Pale yellow color represents no shared spacers (susceptibility), yellow one shared spacer, orange two shared spacers, and red three shared spacers. The silhouette width (Text S3) was maximized to cluster both hosts (columns) and viruses (rows) into an optimal number of sub-populations based on immunity profiles. Distinct host sub-populations possess immunity to distinct viral sub-populations.

