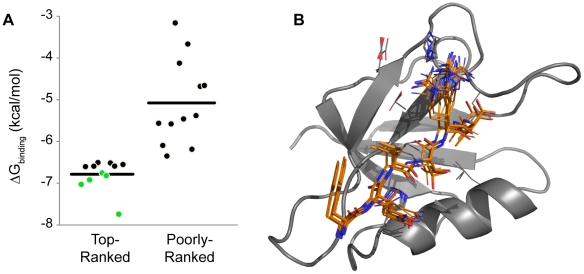
Figure 5. (A)  G values for top- and poorly-ranked
  predictions that were experimentally tested using fluorescence polarization.
Predictions plotted in green denote that the binding affinity was higher than the best previously known hexamer ( ). Horizontal line represents average
  G for plotted sequences. Sequence information and binding data can be found in Tables 1 and 2. (B) Ensemble of top 100 conformations for the peptide (kCAL01: WQVTRV, orange sticks) with tightest binding to CAL (gray ribbon).

