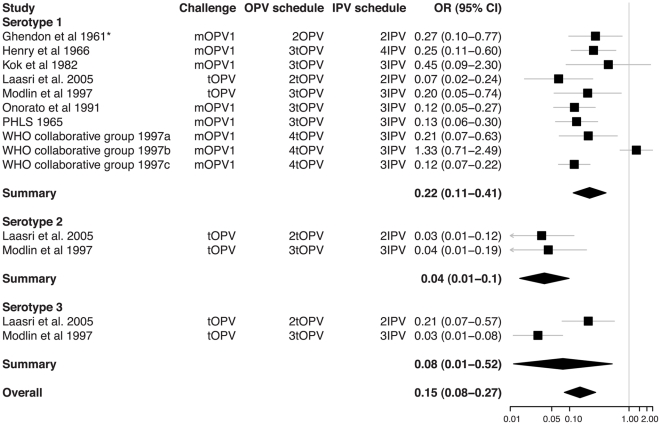
Figure 4. Relative odds of shedding vaccine poliovirus after challenge among individuals vaccinated with OPV compared with IPV.
Labeling as for Figure 2. The χ2 test for heterogeneity among studies was significant for serotypes 1 and 3 (p-values<0.001, 0.79, and 0.01 for serotypes 1, 2, and 3, respectively) and for the overall odds ratio (p-value<0.001). *Ghendon et al. 1961 [17] compare vaccinated and unvaccinated children who were confirmed seropositive and seronegative, respectively.

