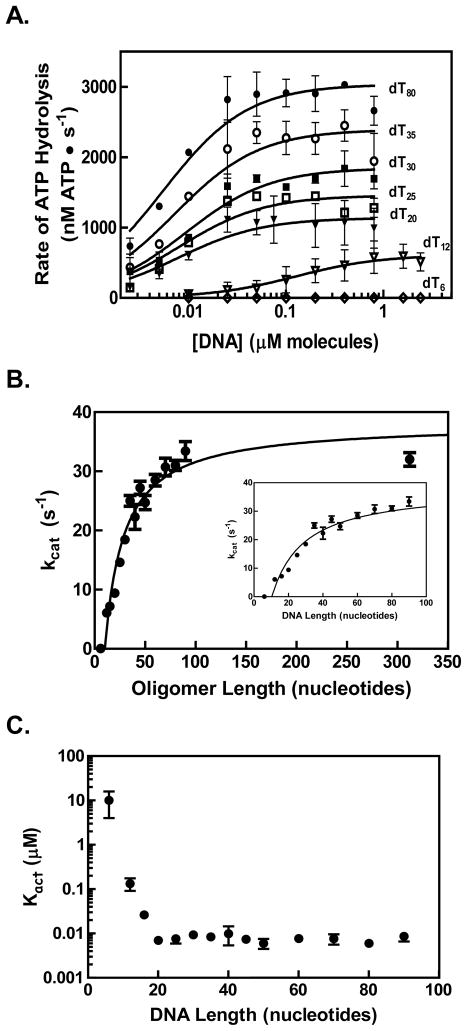
Figure 2. The rate of ATP hydrolysis by RecQ increases for longer DNA substrates.
(A) Representative titrations of RecQ (100 nM) with oligonucleotides (dTn) of various lengths (n) are shown on a semi-log plot. The data were fit to equation 1 in the text (solid lines) to obtain a maximum velocity (Vmax) and a Kact value for each titration. (B) The kcat for ATP hydrolysis by RecQ is plotted as a function the DNA length (black circles). The specific activity (kcat) was determined by dividing the Vmax derived from each oligonucleotide titration by the total RecQ concentration. The data were fit to equation 2 (solid black line). The inset graph is a magnified view showing shorter lengths. (C) Values determined for Kact are plotted against DNA length.

