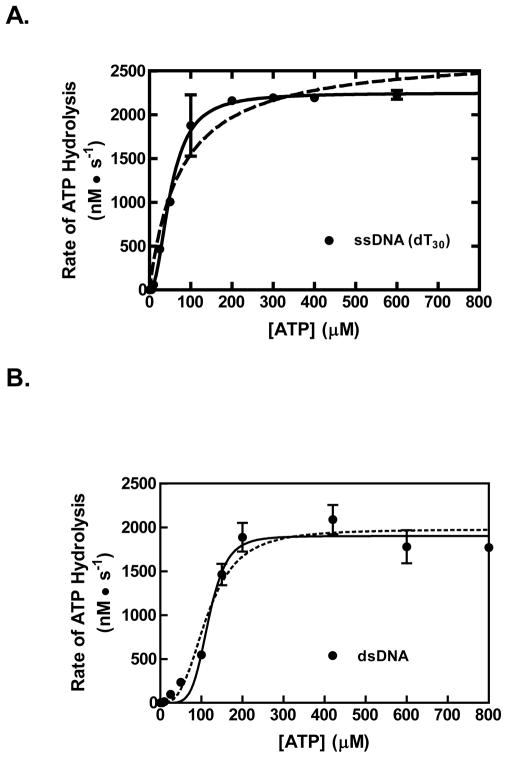
Figure 4. The ssDNA-dependent ATP hydrolysis activity of RecQ is cooperative with respect to ATP concentration.
The rate of ATP hydrolysis by RecQ (100 nM) stimulated by dT30 (0.3 μM, molecules) is plotted as a function of ATP concentration (black circles). The data were fit to the Hill equation (solid line, R2= 0.98). For comparison, a fit to a hyperbolic equation is shown (dashed line, R2= 0.95) (B) The rate of ATP hydrolysis by RecQ (100 nM) stimulated by linear pUC19 (2.5 μM, base pairs) is shown (black circles). The data were fit to the Hill equation (solid curve, r-squared value of 0.98). For comparison, a fit to the Hill equation with the Hill coefficient held constant at 3 is shown (dotted curve, r-squared value of 0.95).

