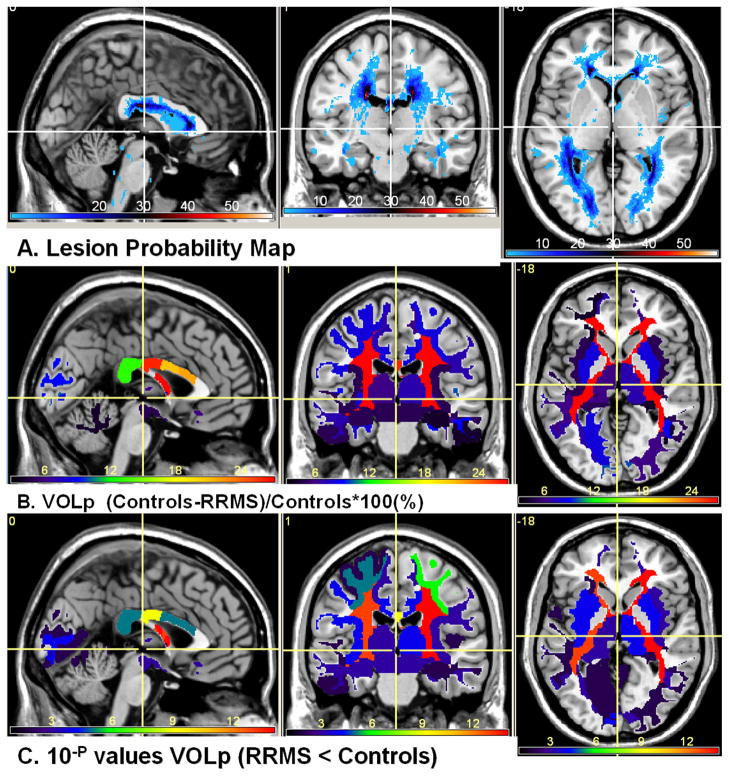
Figure 4.
(A) Lesion probability map on the 68 RRMS patients (B) The percentage ICV-normalized normal-appearing volume difference (significant atrophy RRMS < Controls). Note that largest normal-appearing tissue atrophy (volume loss) is in deep periventricular white matter. Note that lesions in our RRMS cohort were least frequent in the thalamus yet the volume difference is significant. The color map (minimum dark blue) in the upper views corresponds to the percentage (maximum about 28% (bright red) in periventricular white matter and corpus callosum isthmus and (C) the corresponding the group difference p values (analysis-of-variance).

