
Figure 1.
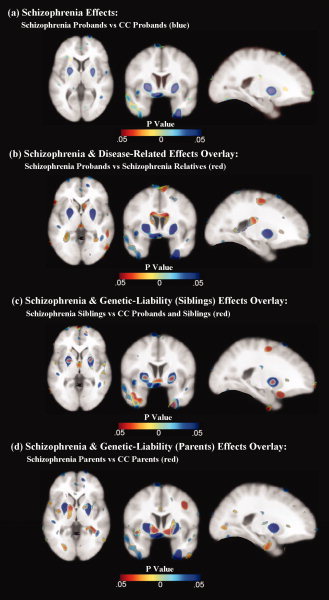
The top panel (a) shows effects of schizophrenia in cold hues. To illustrate the spatial overlap of schizophrenia effects and disease‐related effects, results from both comparisons are superimposed in the second panel (b) with schizophrenia effects shown in cold colors and disease‐related effects shown in hot colors. Schizophrenia effects (cold colors) and genetic liability effects (hot colors) are shown overlaid in the bottom two panels for siblings (c) and parent groups (d), respectively. All statistical maps represent FDR thresholded results. [Color figure can be viewed in the online issue, which is available at wileyonlinelibrary.com.]