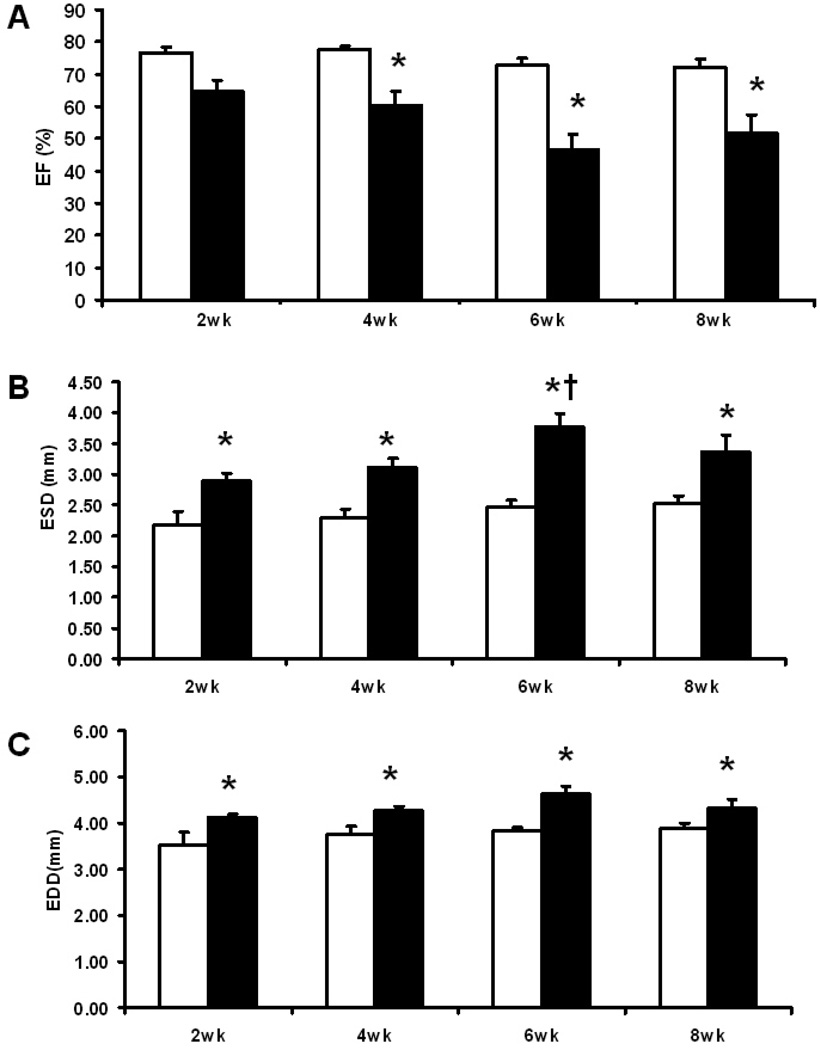
Fig. 2.
Echocardiographic results: (A) LV Ejection fraction (%); (B) LV end systolic diameter (mm); (C) LV end diastolic diameter (mm). Open columns for sham groups, closed columns for TAC groups. *, p<0.05 compared to the respective sham; †, p<0.05 compared to TAC at 2 wks. Sample size was 5 – 6 for sham mice and 8–10 for TAC mice at each time point.

