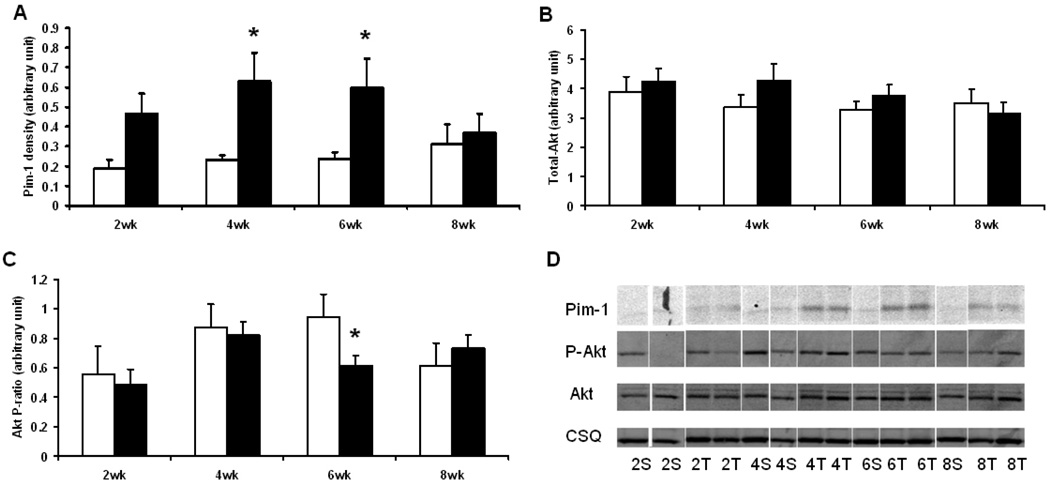
Fig. 5.
Immunoblot analysis of Pim-1 and Akt: (A) Pim-1 density (arbitrary unit); (B) total Akt density (arbitrary unit); (C) Akt phosphorylation ratio (arbitrary unit), obtained by phosphor-Akt (Ser473) density normalized by total Akt density. Open columns for sham groups, closed columns for TAC groups. *, p<0.05 compared to the respective sham. (D) Representative immunoblot strips for Pim-1, p-Akt, Akt and calsequestrin (CSQ). Samples are labeled as the number of weeks post-surgery followed by the type of surgery (S for sham, T for TAC). Sample size was 5 – 6 for sham mice and 8–10 for TAC mice at each time point.

