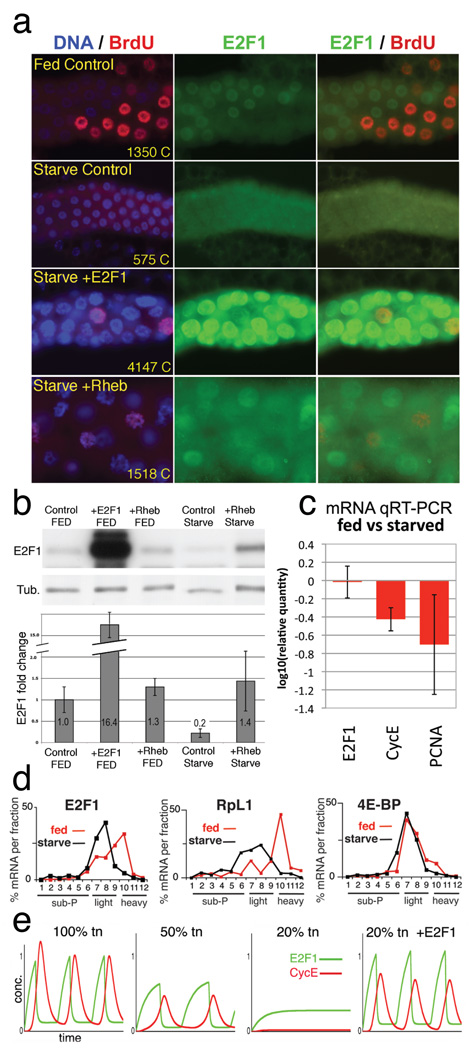
Figure 4. E2F1 is a growth sensor.
a) Salivary glands labeled for DNA (blue), E2F1 (green), and incorporated BrdU (red). Fed Control (WT) was labeled with BrdU at 48h and fixed at 49h. “Starved” animals were transferred to protein-free media at 48h AED, labeled with BrdU at 96h, and fixed at 97h AED. ptc-Gal4 drove expression of UAS-E2F1/DP or UAS-Rheb in the lower two panels. Chromatin (C) values are average nuclear DNA values from 10 glands measured at 120h AED. b) Immunoblot of salivary glands as in a, with quantitation, normalized to tubulin, below. c) mRNA levels from starved and fed control glands, measured by qRT-PCR. d) mRNA levels from 3d protein-starved (black) or fed control (red) whole larvae, quantified from polysome gradient fractions by qRT-PCR. X axis indicates gradient fraction number. e) Computational simulation of starvation by reducing total protein synthesis (tn). In the “20% tn +E2F1” graph, translation of E2F1 was 100% of normal but translation of all other proteins was reduced to 20%. Graphed values (b, c) include standard deviations calculated from 3 independent biological samples.

