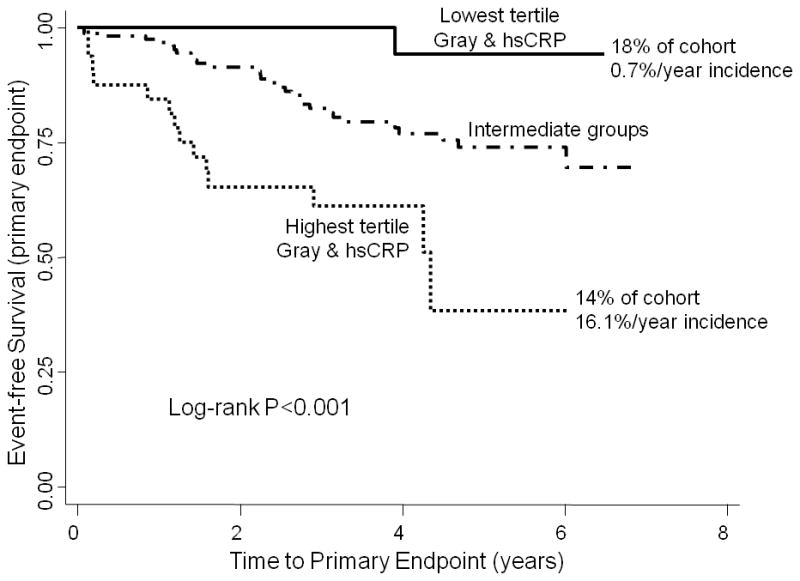
Figure 3.


Kaplan-Meier curves showing time to the primary endpoint (ICD firing and cardiac death, Figure 3A) and secondary endpoint (appropriate firing alone, Figure 3B) grouped by GZ-hsCRP tertiles. The GZ tertiles corresponding to low-risk were: in nonischemics, GZ=0 grams; in ischemics, maximal GZ cutoff=8.7 grams. For the highest tertile group, GZ cutoffs were: ≥1.7 grams in nonischemics and ≥17.9 grams in ischemics. hsCRP cutoffs were: ≤1.8 mg/L for the lowest tertile and ≥5.9 mg/L for the highest tertile.
