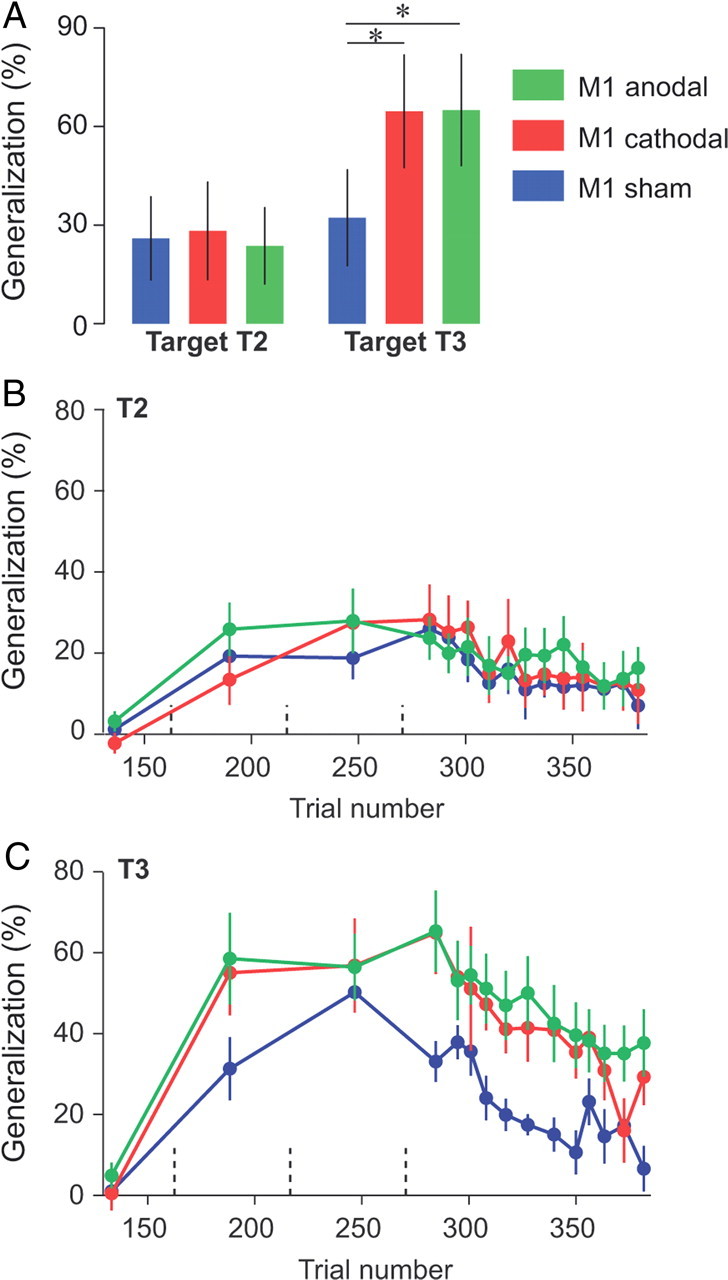
Figure 2.

Effect of tDCS on the generalization index. A, Generalization index immediately following learning. The average force at tangential peak velocity for T2 and T3 across the first three channel trials was divided by the same force for T1 for each individual subject. Error bars are confidence intervals. B, C, Evolution of the generalization index over the course of error-clamp trials. Data were averaged over three error-clamp trials (bin size) and are presented for each target separately. Dashed vertical lines represent set breaks. Asterisks indicate significant differences. Error bars are SEM.
