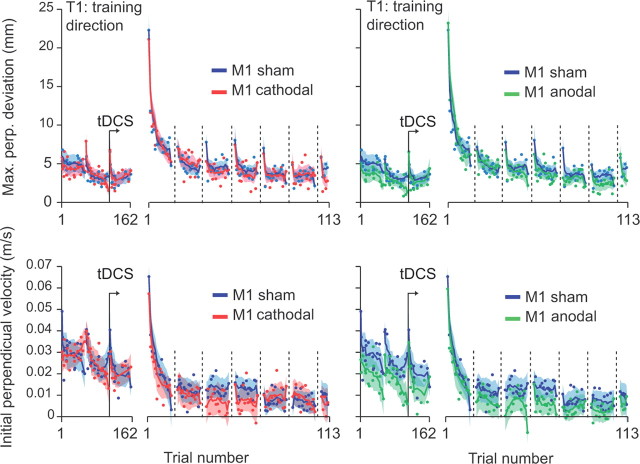
Figure 3.
Measures of kinematics during baseline (1–162) and learning periods (1–113). Evolution of the maximum perpendicular (Max. perp.) deviation (top) and the perpendicular velocity 100 ms after movement onset across trials for cathodal versus sham groups (left) and anodal versus sham (right). Each point represents the average of all subjects for one trial and the solid lines represent a running average over 10 trials and interrupted every 15 trials during the field blocks.

