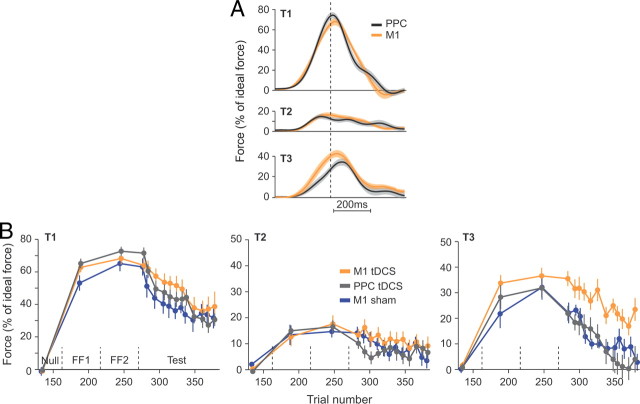
Figure 4.
Site specificity of the tDCS effect: M1 versus PPC. A, Normalized force profiles recorded during the first three error-clamp trials to each of the three targets during the test block. Force profiles were aligned on peak tangential velocity and normalized with ideal force at peak tangential velocity. B, Evolution of the normalized force at peak tangential velocity over the course of error-clamp trials. Force data were averaged over three error-clamp trials (bin size) and are presented for each target separately. Data from the sham group (Fig. 1) were added for the sake of comparison between the sham and the PPC groups. Dashed vertical lines represent set breaks.

