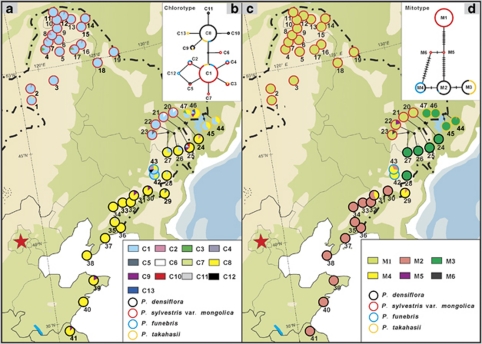
Figure 1.
Distributions and networks of chlorotypes (a, c) and mitotypes (b, d) among four pine species in Northeast China. The color of the circumference of circles in (a) and (c) indicates each species and in (b) and (d) is proportional to the frequency of each chlorotype or mitotype in each species. The color filled in circles in (a) and (c) is proportional to the frequency of each chlorotype or mitotype in each population.

