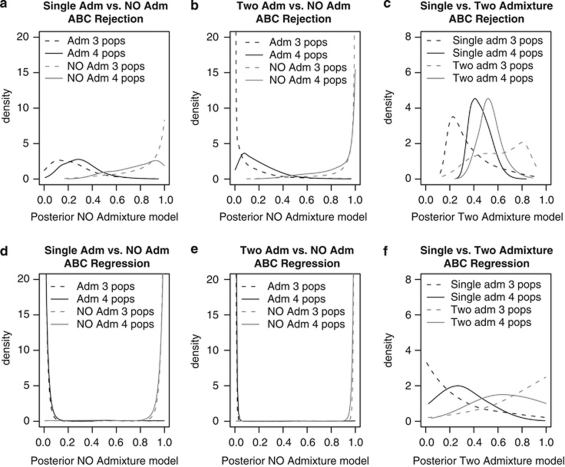
Figure 2.
Distribution of the posterior probabilities for the population split without admixture model (NO admixture; a, b, d, e), and for the two-event admixture model obtained with the simulated data sets (c, f). Each curve was obtained with the analysis of 10 000 simulated data sets. In (a), (b), (d) and (e), black lines correspond to data sets generated under the admixture models, whereas gray lines correspond to data sets generated under the NO admixture models. In (c) and (f), black lines correspond to data sets generated under the single-admixture models (single adm), and gray lines correspond to data sets generated under the two-event admixture models (two adm). Solid lines correspond to the four-population models and dashed lines to the three-population models. The simulated test data sets were simulated with parameters sampled from the priors of each model.

