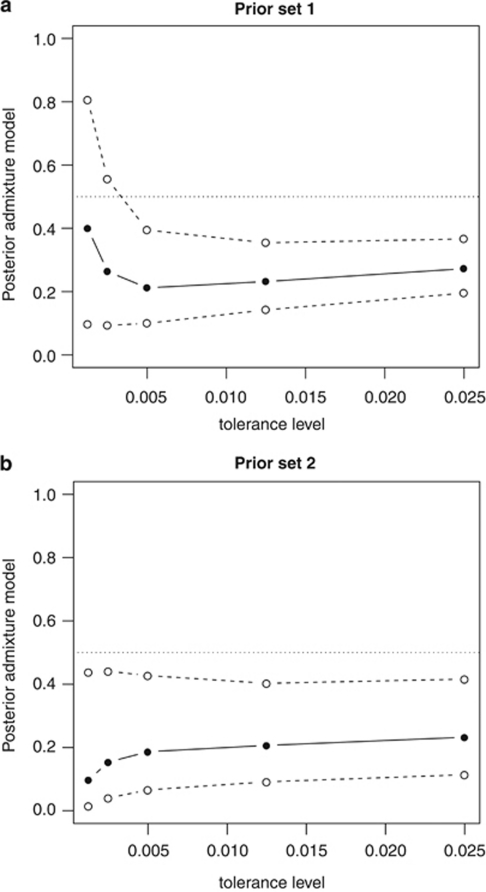
Figure 5.
Posterior probability for the single-event admixture model (admixture) obtained for I. lusitanicum, for the model comparison of single-event admixture vs population split without admixture. Posterior probabilities for the admixture model shown as function of the tolerance level, for: (a) results obtained with the first prior set; (b) results obtained with the second prior set. Solid lines correspond to the results obtained with the regression step and the dashed lines correspond to the 95% confidence interval. The horizontal dotted lines correspond to the prior probability of 0.50, meaning that both models are equally likely.

