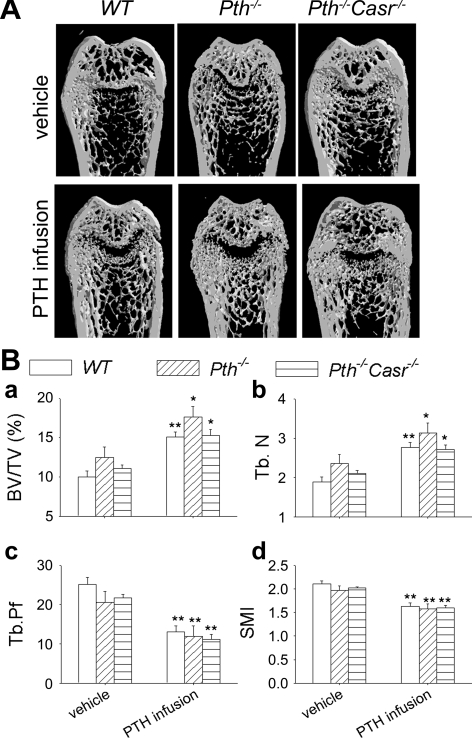
Fig. 6.
Analysis by μCT of the effects of continuous PTH infusion on the trabecular bone phenotype. A: representative longitudinal μCT reconstructed sections of femurs from 12-wk-old WT, Pth −/−, and Pth −/−-Casr −/− mice infused with 60 μg·kg−1·day−1 hPTH(1–34) or vehicle for 2 wk. B: μCT analysis of femoral trabecular bone showing bone volume/tissue volume (BV/TV; a), trabecular number (Tb.N; b), trabecular pattern factor (Tb.Pf; c), and structure model index (SMI; d) Each value is the mean ± SE (n = 8/genotype). Symbols indicate significant changes using 1-way ANOVA, as described in Statistical analysis. *P < 0.05 and **P < 0.01 compared with vehicle-infused mice of the corresponding genotype. Results of 2-way ANOVA using genotype (Pth−/− and Pth−/−-Casr−/−) and PTH infusion treatment (vehicle and PTH infusion) as main effects: BV/TV: genotype, P = 0.04; PTH, P < 0.001; genotype × PTH, P = 0.603. Tb.N: genotype, P = 0.051; PTH, P < 0.001; genotype × PTH, P = 0.615. Tb.Pf: genotype, P = 0.939; PTH, P < 0.001; genotype × PTH, P = 0.597. SMI: genotype P < 0.572; PTH, P < 0.001; genotype × PTH, P = 0.82.

