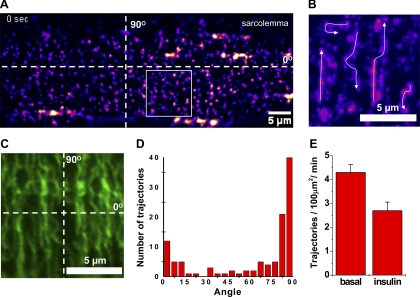
Fig. 6.
Localization and trafficking of HA-GLUT4-GFP vesicles in the vicinity of the sarcolemma of isolated muscle fibers. A: total internal reflection fluorescent (TIRF) microscopy was used to visualize trafficking of HA-GLUT4-GFP vesicles near the sarcolemma of isolated FDB fibers. Image shown is a representative region of sarcolemma of a live FDB fiber isolated from a HA-GLUT4-GFP Tg mouse. Fluorescence intensity is shown in pseudocolor. Dotted lines correspond to 0 and 90° axes parallel and perpendicular to the fiber axis and represent the main directions of vesicular movements (see Supplemental Movie 1). B: time-lapse projection image of region outlined in A showing trajectories of mobile GLUT4 vesicles detected during 60 s of recording. Fluorescence intensity is shown in pseudocolor. Arrows show direction of movement. Bar, 5 μm. C: microtubular network visualized with immunofluorescence confocal microscopy in isolated FDB fibers. Isolated muscle fibers were stained with mouse anti-tubulin antibodies and goat anti-mouse-Alexa 594 secondary antibodies. Image shown is a representative sarcolemma region of FDB fibers observed in 3 independent experiments. Bar, 5 μm. D: angular distribution of GLUT4 vesicle traffic; 114 trajectories from 15 cells were analyzed and their angles measured relative to the fiber axis shown in A. Note preferential direction of traffic along T-tubules that corresponds to the 90° peak. E: comparison of GLUT4 vesicle traffic measured in basal and insulin-stimulated states. Data represent mean number of trajectories detected per 100 μm2 region per minute. Trajectories were measured in 2–3 regions per cell, with ≥15 cells analyzed in each state.

