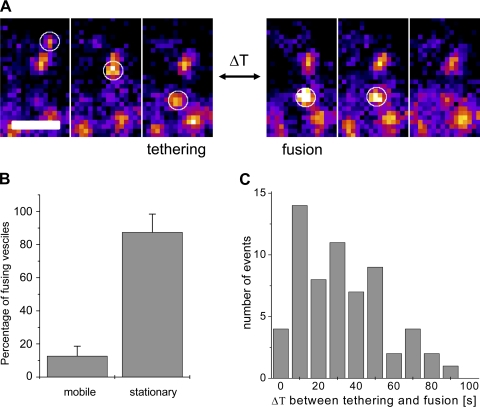
Fig. 8.
Insulin-induced fusion of stationary and mobile GLUT4 vesicles. A: example of tethering event followed by fusion. Three sequential time frames on the left show arrival and tethering of vesicle; 3 sequential time frames on the right show fusion of the vesicle. ΔT represents time delay between tethering and onset of fusion and, in the example shown, represents 28 skipped frames (ΔT = 28 s). All sequential frames are 1 s apart. Fluorescence intensity is shown in pseudocolor. Bar, 2 μm. B: relative number of stationary and mobile vesicles that undergo insulin-stimulated fusion. A total of 491 fusion events were analyzed, and the majority of vesicles were found to be stationary (for >2 min) prior to fusion. Data are means ± SE; n = 15 cells. C: histogram of time delay (ΔT) between tethering and fusion observed for 62 vesicles that were mobile before fusion (as shown in A).

