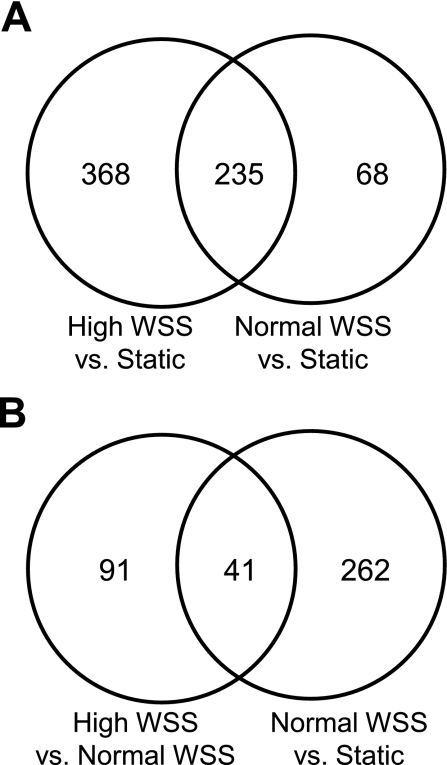
Fig. 2.
Venn diagrams of the number of genes that are differentially regulated by various flow conditions. A: genes that are differentially expressed when endothelial cells (ECs) under high WSS (10 Pa) or normal WSS (2 Pa) are compared with static cultures. The overlap of the two circles represents genes whose expression is altered when static ECs encounter flow, regardless of whether WSS is normal or high. B: genes that are expressed when ECs under high WSS or maintained in static culture are compared with normal WSS. The overlap represents genes that are affected when static ECs encounter normal WSS, but also change further, or in the opposite direction, when normal WSS is increased to 10 Pa.

