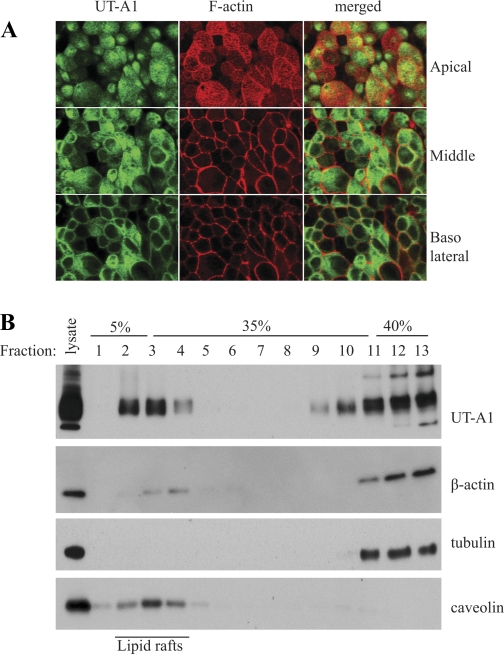
Fig. 2.
Colocalization of UT-A1 and the cortical F-actin cytoskeleton. A: confocal microscopy. UT-A1-MDCK cells were grown on Transwell filters for 5–6 days. The cells were then fixed and permeabilized. UT-A1 was immunostained with anti-UT-A1 antibody and subsequently visualized with FITC-conjugated goat anti-rabbit IgG antibody. The filamentous (F) actin was stained by Texas Red-X phalloidin. The image was obtained by confocal microscopy. Whole cells were scanned from the top (apical side) to the bottom (basolateral side) as a cross section through the cell (x-y section). B: lipid raft study. UT-A1-MDCK cells were lysed in 0.5% Brij 96V-TNEV buffer, then applied to 5–40% discontinuous sucrose gradient ultracentrifugation. Fractions were collected from the top to bottom and analyzed by immunoblotting for UT-A1, actin, tubulin, and caveolin.

