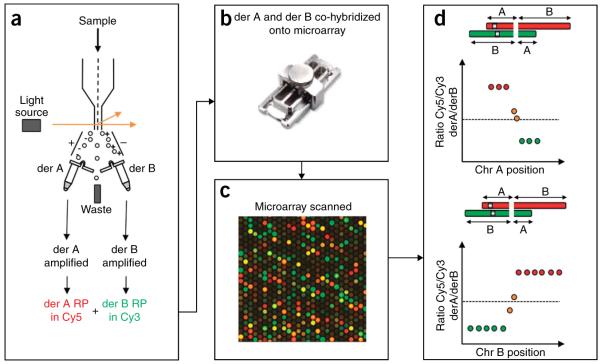
Figure 1.
A schematic outlining the steps of an array paint experiment. (a) Derivative chromosomes are isolated from a cell line by chromosome sorting (Steps 1–22), the derivative chromosomes are then amplified using a GenomePlex Complete Whole Genome Amplification Kit, (Steps 23–38) and the derivative chromosome amplified DNA is fluorescently labeled in Cy3 or Cy5 (Steps 39–54). (b) The fluorescently labeled derivative DNA is hybridized onto a microarray using Agilent SureHyb chamber (Steps 55–80) (picture courtesy of Agilent). (c) The microarray is scanned (Steps 81–83). (d) The features on the microarray are analyzed, the log2 ratio of Cy5/Cy3 intensity is calculated for each oligonucleotide and plotted against the base-pair chromosome position (Steps 84–85). The top schematic represents the data for one parent chromosome (chr A), whereas the lower schematic represents the other parent chromosome (chr B). The transition from a high (red spots) to a low log2 ratio (green spots) indicates a chromosome breakpoint. If a feature sequence spans a chromosome breakpoint, the ratio will be close to 0 (orange spots).

