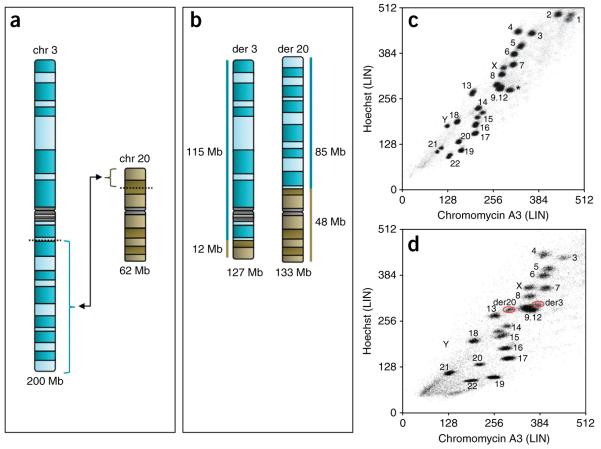
Figure 3.
A schematic detailing the flow sorting of the derivative chromosomes resulting from a translocation between chromosomes 3 and 20, t(3;20)(q13.2;p12.2). (a) Ideograms of chromosomes 3 (200 Mb) and 20 (62 Mb). (b) Ideograms of derived chromosome 3 (127 Mb), and of derived chromosome 20 (133 Mb). (c) Flow karyogram (100,000 events) showing the positions of all normal chromosomes in the human genome. *a chromosome 9 sorting away from the 9–12 cluster in this normal cell line due to a large heterochromatic region. (d) Flow karyogram (50,000 events) showing the actual positions of the derived chromosome 3 and derived chromosome 20 (red rings). NB: Chromosomes 1 and 2 are not in the karyogram because the voltage for both the Hoechst and Chromomycin channels are enhanced to make the derivative chromosome clusters more distinguishable.

