
Figure 4.
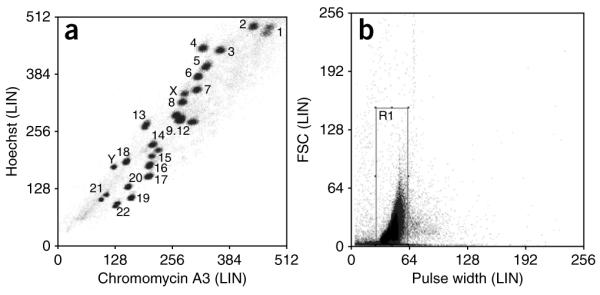
Bivariate flow karyotype of chromosomes from a normal male human lymphoblastoid cell line, GM7016A. (a) The flow karyogram is gated on R1 and displayed as a density plot of Hoechst versus Chromomycin fluorescence. (b) Box shows region gate R1, created on linear forward scatter versus linear pulse width to exclude clumps and debris.