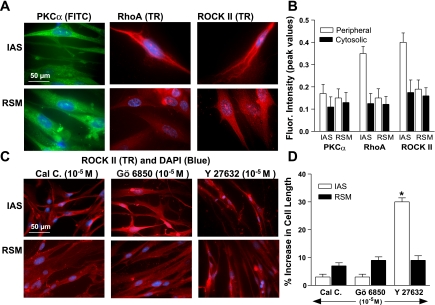
Fig. 5.
A: immunocytochemical images show diffuse distribution of PKC-α throughout the IAS and RSM smooth muscle cells (SMCs). Conversely, data show a discretely higher membranous distribution of RhoA/ROCK II in the IAS vs. the RSM SMCs. B: bar graph data showing higher levels of RhoA/ROCK II vs. PKC-α in the membrane of the IAS SMC vs. RSM (*P < 0.05). C: immunocytochemical images show redistribution of ROCK II by Y 27632, and not by calphostin C (Cal C) and Gö 6850. Such images were also used to determine significantly higher increase in the SMC lengths by Y 27632 compared with calphostin C and Gö 6850 (D).

