Fig. 8.
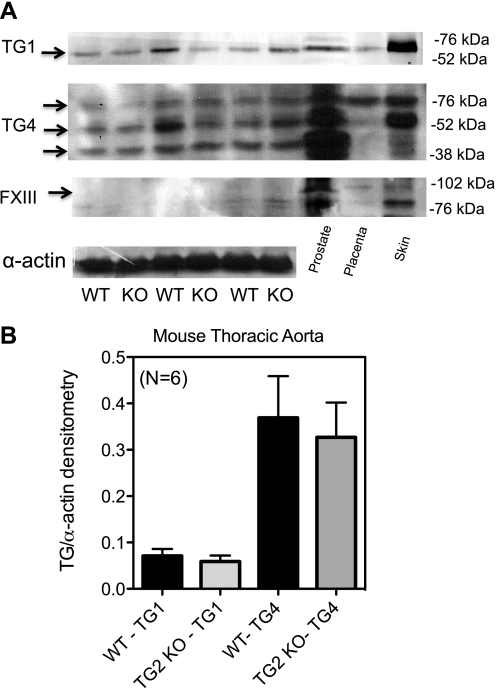
TG isoform expression in the aorta of WT and TG2 KO mice. A: Western analysis of TG1, TG4, and FXIII in the TG2 KO and WT mouse. B: densitometric analysis of TG1 and TG4 in the TG2 KO mouse shows no statistical difference in the level of protein present between these 2 animals. Level of TG protein was compared with the amount of α-actin present. Arrows point to bands used for densitometry. Data represent aortae taken from 6 different WT and KO TG2 mice. P ≤ 0.05.

