Fig. 5.
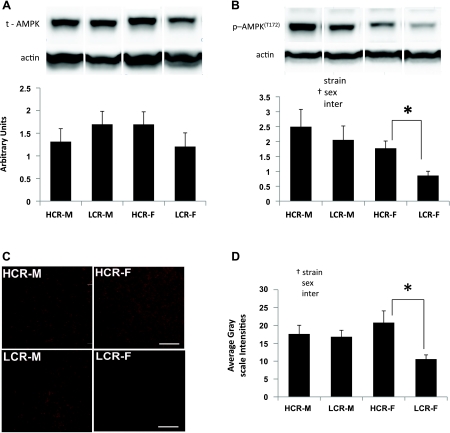
A and B: total (t) AMP-activated protein kinase (AMPK) and Thr172-phosphorylated AMPK [p-AMPK(T172)] content in myocardial protein extracts from the LV of HCR-M, HCR-F, LCR-M, and LCR-F. Representative bands are shown above the bar graphs. Values are means ± SE; n = 4 or 5 rats/group. C: representative micrographs showing sirtuin 1 (Sirt1) immunoflouresence in the LV. D: quantitation of the immunofluorescence signals (n = 5 rats/group). *P < 0.05; †significant ANOVA main effect.

