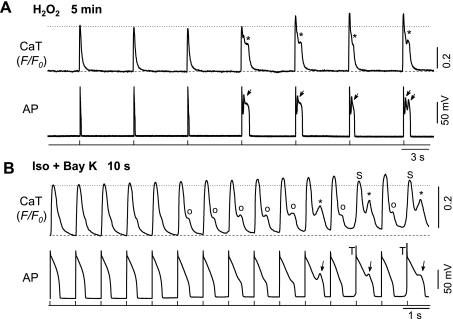
Fig. 2.
Formation process of EADs in different models. A: simultaneous recordings of whole cell (global) Ca2+ transients (CaTs) and APs at 5 min after treatment with 200 μM H2O2. Note the increase of CaT amplitude (F/F0) following the emergence of EADs. B: same as A, except that the myocyte was treated with Iso + BayK (10 s after treatment). Note the Ca2+ accumulation before the emergence of EADs. Spontaneous Ca2+ transients or Ca2+ waves (SCaTs/CaWs) are indicated by ○ and *, which correspond to APD prolongation and EADs (arrows), respectively. Spontaneous CaT (S) and triggered APs (T) are also shown.

